writing / 2026-10-04
BC250 Ronin — preliminary airflow study, Revision C
Solid heatsink caps and the actual exhaust openings
Revision C's computed field sends air out through both the roof and rear perforations. The PCB-mounted heatsinks now block flow through their outer caps and guide air along their vertical channels. Air can also leave around the exposed APU cooler.
This is a rough, preliminary airflow study. The model needs more accurate geometry and a finer mesh before its results can get closer to accurate. Outlet directions agree across the tested ways of sampling the current field, but the absolute rates come from an unresolved 4 mm grid. The calculation has not met all its convergence targets. It does not establish chip temperatures, cooling adequacy, a safe power setting or an overclock.
Ronin is changing rapidly, and the enclosure has not been fabricated. If you want to start building now, contact Arthur first to check the CAD revision and parts list together. These original diagrams come from Ronin's CAD and have no official Voron affiliation.
The full airflow animation
Watch or save the complete 48-second Revision C animation.
The animation replays a frozen steady field at solver iteration 300. The iteration number is not elapsed physical time. Cyan and magenta paths are advected using the computed velocity and checked against CAD barriers. Separate aperture pulses show the sign of flow normal to the sampled surface.
The overlays use an X-ray view without depth occlusion. A path projected over a silver cap does not mean it passes through that cap. The pulses communicate direction; they are not moving particles or a transient heat simulation. Colors do not show temperature.
What changed in the model
Revision B treated the two PCB-mounted heatsink envelopes as porous in too many directions. It also discarded the actual cap faces along with those envelopes. Revision C restores the caps' actual CAD polygons as impermeable walls and adds an inward slab with an assumed thickness of 1 mm.
The original heatsink channels open along the board-height axis, called u in this model. Direction-dependent resistance suppresses movement across the fin webs and toward the capped outer face. The separate Snowman APU stack retains its verified open directions within the fin plane.
| Geometry input or check | Revision C treatment | Status |
|---|---|---|
| Original heatsink fin thickness | Approximately 0.3 mm | Owner estimate; individual fins are not resolved |
| Clear space between original fins | Approximately 2 mm | Owner estimate; below the current grid spacing |
| Outer cap thickness | 1 mm inward slab | Inferred from “fin height = sink height minus about 1 mm”; not a measured thickness |
| Outer cap outline | Actual polygons extracted from the CAD | Retained as solid barriers |
| Cap flow check | No internal fluid links cross either cap; solved wall flux is zero | Numerical barrier check, not physical validation |
The owner identifies the original heatsinks as nickel-plated aluminum. The material is recorded for a future heat-transfer model. This run solves isothermal airflow: it does not use the metal's conductivity or calculate heatsink and chip temperatures.
Within the corrected original-heatsink regions, mean velocity along u is approximately 0.40 m/s at the front and 0.20 m/s at the rear. The transverse root-mean-square velocity components are below 0.001 m/s in both regions. These are diagnostics of the current field, not measured hardware velocities.
The solver is OpenFOAM porousSimpleFoam, with a tensor-implicit momentum update and k–ω SST turbulence. Two pressure sources represent the P9 fans at 3,000 RPM. The model uses approximate directional resistance for unresolved fins rather than explicit fin geometry. The fan-source inputs come from the ARCTIC P9 PWM PST single-fan pressure/flow curve. The OpenFOAM incompressible steady-flow documentation describes the underlying steady-flow framework.
Computed discharge through the openings
Each roof or rear opening is triangulated as an open patch. The calculation reconstructs the solver's native face flux, phi, within each retained fluid cell and integrates it against that patch's actual outward normal. It separates positive and negative normal flow before calculating the net:
Net outward flow = outward flow − inward flow.
Using the surface normal avoids mistaking air moving along an inclined cover for air entering it. The native-flux reconstruction uses an RT0 field: each Cartesian velocity component varies linearly along its own coordinate and matches the corresponding face fluxes. The signed triangle integrals are split where normal velocity changes sign. The Raviart–Thomas element reference and deal.II's Raviart–Thomas documentation describe this reconstruction family.
The following CFM values are provisional solver diagnostics, not validated case airflow. They are rounded to two decimals so the calculation can be audited; the displayed precision does not indicate physical accuracy.
| Sampled surface group | Patches | Surface area | Outward CFM | Inward CFM | Net CFM | Area covered by retained fluid cells |
|---|---|---|---|---|---|---|
| Roof perforations | 158 | 1,293 mm² | 1.73 | 0.01 | 1.72 outward | 88.1% |
| Rear perforations | 219 | 6,828 mm² | 6.09 | 0.11 | 5.98 outward | 88.6% |
| Projected APU external section | 1 | 15,630 mm² | 9.19 | 0.04 | 9.14 outward | 100.0% |
The roof and rear rows sample actual CAD holes. The APU row samples a projected external control section near the exposed stack, at PCB coordinate n = −156 mm. It is not the literal curved cover rim, and it does not isolate flow through the cooler.
Four tiny rear passages could not be recovered unambiguously and remain unassigned. Other I/O openings, seams and control-surface paths are outside this table. These three rows do not close the case's full mass balance and must not be normalized to 100% of fan or case airflow.
Why the airflow numbers remain provisional
The perforations are roughly 3.6 mm wide, smaller than the 4 mm cells. About 12% of their actual patch area lies outside retained fluid cells. Different ways of sampling the same field therefore give substantially different rates.
| Sampled surface group | Native-phi RT0 net CFM | Cell-U net CFM | Staircase-phi net CFM | RT0 net CFM with ±1 mm surface registration |
|---|---|---|---|---|
| Roof perforations | 1.72 | 2.06 | 4.36 | 1.65–1.77 |
| Rear perforations | 5.98 | 6.72 | 8.79 | 5.66–6.30 |
| Projected APU external section | 9.14 | 9.03 | 9.44 | 9.06–9.23 |
The native-phi RT0 method integrates the reconstructed face flux on the actual patch triangles. The Cell-U comparison integrates the solved cell velocity against the same normals and clipped areas. The staircase comparison sums oriented native flux on cell-to-cell links crossing the openings; it reports a net rate and uses a different effective surface area.
For example, staircase sampling gives the roof 1,596 mm² of effective surface support, compared with 1,293 mm² of actual holes. The rear inward-offset staircase result contains six opposing multiple link crossings, which invalidate its simple single-crossing sum. That result is excluded from the valid registration comparison.
The ±1 mm tests translate each aperture patch along its mean outward normal to check how its position relative to the grid changes the result. Each curved rear patch moves as a unit; its shape is preserved. These are representation and registration sensitivity checks, not a validated uncertainty interval.
All three nominal methods and the valid offset comparisons give net outward flow for all three groups. Net port drift between iterations 250 and 300 is below 0.05%. This agreement supports the direction shown in the current snapshot. It does not overcome the unresolved openings or establish accurate rates.
Computed paths on the CAD
Select a diagram to enlarge it. The original lossless velocity-section image is also available.
Solid outer caps
The silver faces are the actual outer-cap polygons extracted from the CAD. The solver restores them as solid barriers. The original heatsink channels remain open along the height of the PCB.
Rear VRAM access
Air reaches the rear heatsink through the large backbone opening. Magenta traces start at actual modeled P9 outlet cells. The view hides the covers and clips half the backbone so the path is visible.
The exposed APU opening
The Snowman stack protrudes through the cover opening. Green markers show the sign of sampled normal flow on the projected external section. They do not isolate throughflow inside the cooler.
Separate roof and rear discharge
Purple markers correspond to roof-hole samples; orange markers correspond to rear-hole samples. Red samples show local inward flux. Marker pulsing encodes direction rather than physical particle movement.
Solved velocity sections
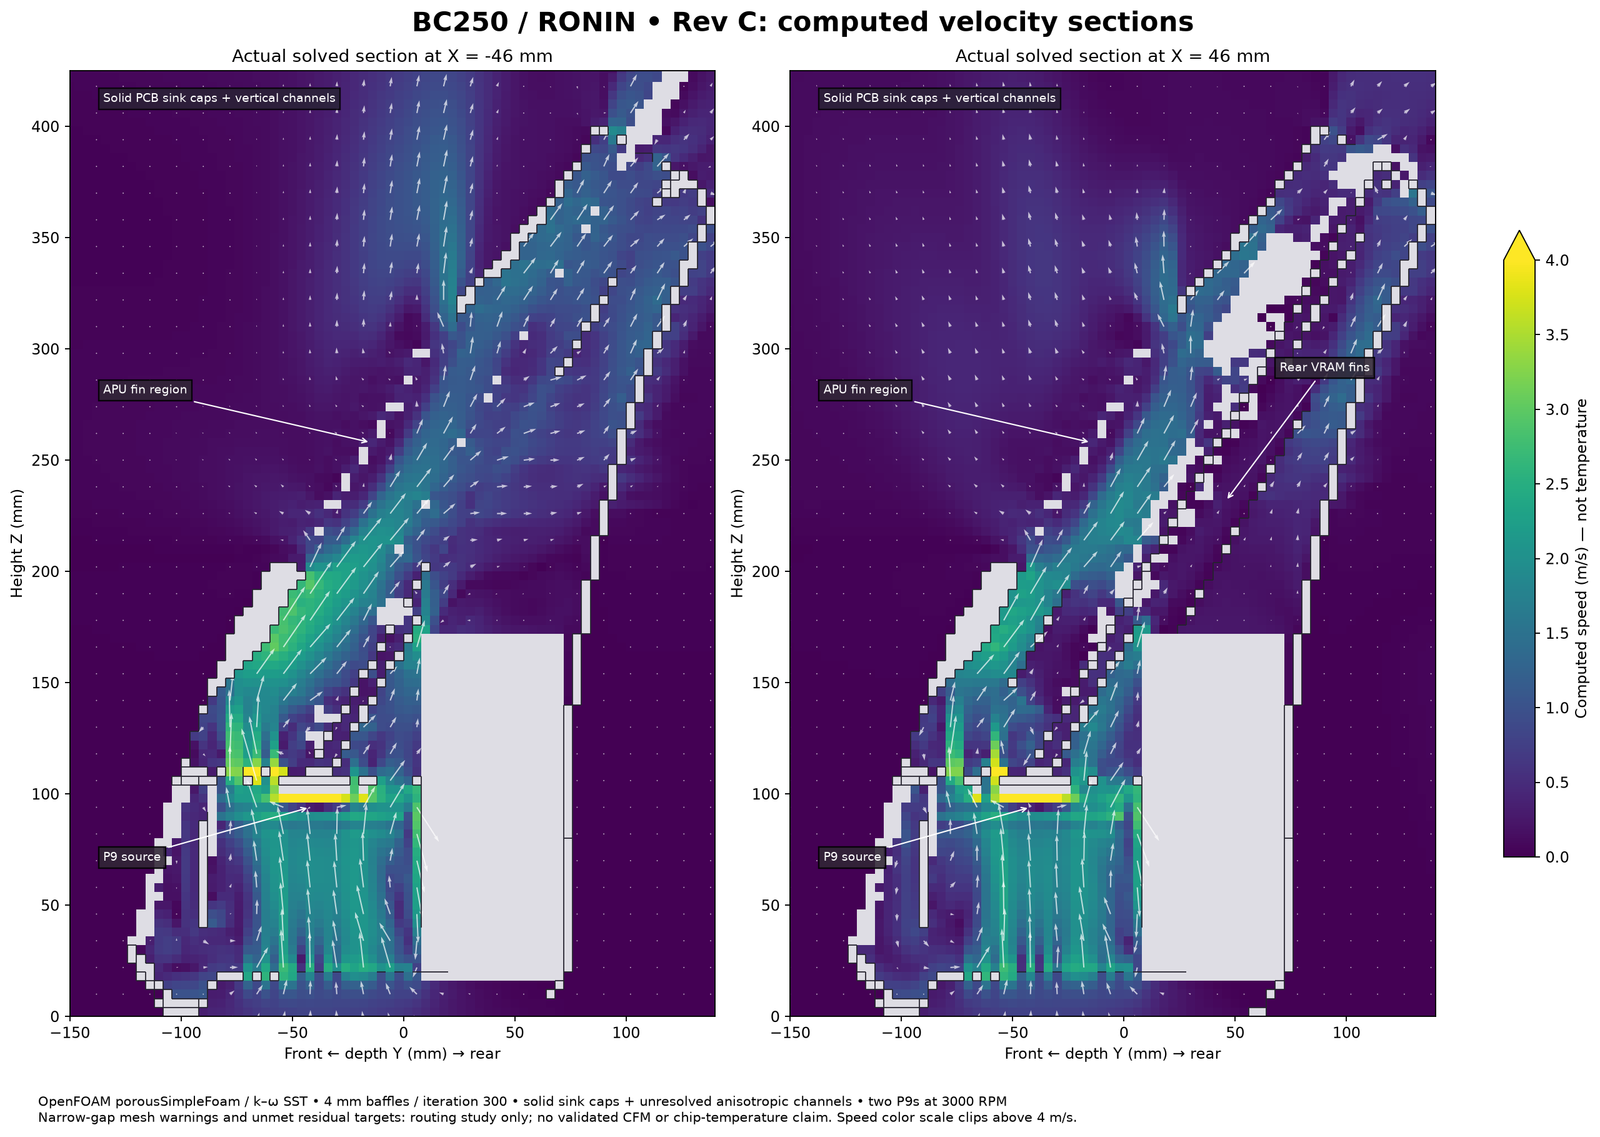
These are the actual solved speed and in-plane velocity at X = ±46 mm. Dark lines mark CAD-derived barriers. The color scale clips above 4 m/s. The local maximum near coarse narrow passages is about 12.9 m/s, but it is not a validated physical peak.
What the current model says about cooling
The snapshot supports the intended routing: air travels upward from the two P9 sources, follows the vertical channels in the original capped heatsinks, reaches rear VRAM through the backbone opening, and leaves through the exposed APU region, rear perforations and roof. Restoring the caps prevents a fictitious shortcut through their metal faces. The channel entrances, exits and backbone opening need to remain clear of wiring harnesses.
The PCB-to-backbone corridor is especially sensitive. Its physical gap is about 6.5 mm, which is only one to two cells wide in this grid. 531 of 3,829 retained cells there, or 13.9%, fail the internal-neighbor determinant criterion. Across the whole mesh, 3,697 cells are flagged. A small global proportion does not validate this critical cooling route.
The next useful work is local mesh refinement below the vent width and within the rear gap, exact CAD fin channels and cap thickness, and representation of the filters and completed cable routing. Refinement must retain the real thin walls and rear gap; closing the gap to remove a mesh warning would change the design being studied.
A coarser 6 mm run would not improve the resolution of 3.6 mm vents. Earlier Revision B 4/6 mm comparisons used different heatsink physics and do not establish grid convergence or a valid grid-convergence-index result for Revision C.
Cooling quality still needs physical fan-speed and temperature measurements under sustained load in the assembled enclosure. A future heat-transfer model also needs board heat loads, contact interfaces and material properties. The optional ARCTIC P12 Slim is not installed or represented in this run.
Numerical verification and convergence limits
The selected field is finite and locally stationary. Its global ambient-envelope mass imbalance is 0.00203%. The native-phi reconstruction reproduces the cell-divergence integral to a maximum difference of 3.31 × 10⁻¹⁹ m³/s.
Those checks verify numerical conservation and reconstruction arithmetic. They do not verify the geometry or establish physical accuracy. Pressure, turbulence-energy and dissipation residual targets remain unmet. checkMesh reports an internal-neighbor determinant failure. This is not a fully converged or validated CFD case.
Some narrow-passage cells have too few independent internal-face directions after thin-wall barriers are preserved. Their cubic volumes remain positive and their faces orthogonal, but that does not cure the determinant failure. It is concentrated in the passages where resolution matters most.
Trajectory audit and playback limits
The trajectory audit starts with 360 modeled fan-outlet seeds and contains 48,902 accepted steps, with zero accepted wall crossings. Of those sampled paths, 52 visit the APU region, 26 visit the rear heatsink and 17 visit the front heatsink.
These counts are spatial samples, not airflow fractions or probabilities. 288 paths stop at a coarse cell or barrier boundary. The guards terminate those paths rather than drawing them through walls; a stopped trace does not prove a physical dead end.
The animation displays 120 selected paths with periodic reseeding. Path motion is shown at 25 times slower than physical advection time. Aperture markers use illustrative pulsing to show the sign of normal flux. The exported video is 48 seconds, 1,920 × 1,080, at 20 frames per second.
The animation presents advection through the frozen field, not a time-dependent airflow or temperature calculation. X-ray projections have no depth occlusion. Neither visible path counts nor aperture-marker counts represent mass-flow shares.
Source and reproducibility
The model uses the frozen, read-only SolidWorks export prepared for Revision B. No CAD changes or saves were made for this study. The views use exact native triangles rather than convex hulls.
Download the full report evidence package for the original HTML report, its five PNG figures, the complete video and compact source records. The raw solver fields, full CAD meshes and reproduction scripts are retained in the project archive and are not part of this download.
The source and method records are listed below. Documentation follow-ups are an internal revision queue, not final build instructions:
| Record | What it preserves |
|---|---|
selected_case.json | Selected case, iteration and hashes of source fields |
geometry/capped_sink_geometry.json | Cap geometry, inferred dimensions and channel-model assumptions |
method_validation/revision_c_solver_and_port_qa_summary.json | Numerical checks, outlet diagnostics and limitations |
trajectories_qa.json | Wall-crossing checks, accepted steps, seed counts and path limits |
geometry/case_4mm_capped_critical_mesh_qa.json | Mesh failures, especially in the PCB/backbone corridor |
geometry/flux_apertures.json | Actual roof/rear aperture patches and the projected APU section |
method_validation/actual_ports_300.json | Full signed-flux integration and representation/registration checks |
animation/animation_manifest.json | Animation source, selected paths, timing and export settings |
README_Rev_C.md | Method notes and names of reproduction scripts |
MANUAL_FOLLOWUP.md | Concrete work queued for the next documentation revision |
The source geometry JSON has SHA-256:
3c931d1c8392592ff1fcf1b2396342300a073ab0b2a1ac6675d271236d17e32a
The selected solved-field NPZ has SHA-256:
87038520656765e3725e192bb7c522469abaa08c574610041905d52f95bed8ee
The primary technical references are the ARCTIC P9 PWM PST curve, the OpenFOAM steady incompressible framework, the Raviart–Thomas element reference, and deal.II's Raviart–Thomas implementation documentation. They explain model inputs and methods; they do not validate this case's cooling performance.